Understanding Linear Equations
Linear equations are the foundation of algebra and one of the simplest yet most powerful tools in mathematics. They describe relationships where one variable changes at a constant rate relative to another. In real life, this means linear equations can model steady growth, proportional relationships, and consistent rates of change — from business profit margins to motion and finance.
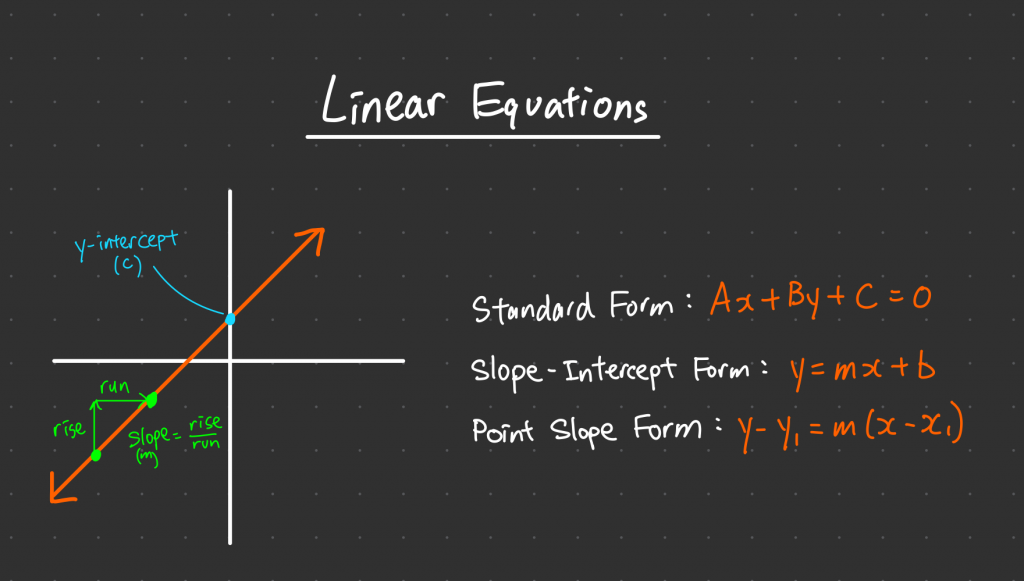
The general form of a linear equation is: y=mx+by = mx + by=mx+b
where m is the slope (rate of change), and b is the y-intercept (the point where the line crosses the y-axis). Together, they define a straight line that represents a constant relationship between x and y. This simplicity makes linear equations essential in both theoretical and applied mathematics.
The Slope–Intercept Form Explained
The slope–intercept form allows us to visualize and interpret how changes in one variable affect another. The slope (m) determines the steepness or direction of the line — positive slopes rise, negative slopes fall. The intercept (b) shows where the function begins when x = 0.
| Slope (m) | Behavior of the Line | Example Equation | Description |
|---|---|---|---|
| Positive | Line rises left to right | y = 2x + 3 | Direct relationship |
| Negative | Line falls left to right | y = -3x + 5 | Inverse relationship |
| Zero | Line is horizontal | y = 4 | Constant function |
| Undefined | Line is vertical | x = 6 | No function (fails vertical line test) |
In this sense, linear equations are a bridge between geometry and algebra — turning geometric intuition into numerical precision. Every straight line on a coordinate plane tells a story about balance, proportion, and direction.
Systems of Linear Equations
Sometimes, we deal with more than one linear equation at a time. Such systems of linear equations are used to find the intersection point where two or more relationships meet.
For instance: {2x+y=10x−y=2\begin{cases} 2x + y = 10 \\ x – y = 2 \end{cases}{2x+y=10x−y=2
Solving this system gives x = 4, y = 2, meaning both equations are satisfied at the same point. These techniques form the core of linear algebra, which underlies everything from 3D graphics to machine learning and economics.
There are three possible outcomes for any linear system:
| Type of Solution | Description | Graphical Meaning |
|---|---|---|
| One solution | Lines intersect once | Consistent and independent |
| No solution | Lines are parallel | Inconsistent system |
| Infinite solutions | Lines coincide | Dependent system |
Linear Equations in Real Life
Linear equations are found everywhere — in technology, science, and daily decision-making. They are used to forecast trends, calculate costs, or determine when two quantities will meet or balance.
Examples of real-world use:
- Economics: predicting sales and profit growth over time.
- Physics: describing uniform motion (distance = rate × time).
- Finance: calculating interest and depreciation.
- Engineering: designing components with constant load distributions.
- Statistics: fitting data using linear regression models.
Linear equations are often the first step toward understanding complex models, as many nonlinear systems can be approximated by linear relationships over small intervals — a principle called linearization.
Mathematical Connections: Probability and the Plinko App
Mathematics is full of analogies between certainty and randomness, and linear equations help us interpret both. Just as a straight line represents a consistent rate of change, probabilities often show how outcomes shift along predictable patterns when scaled.
Example: The Plinko App and Linear Relationships
The Plinko App offers a visual representation of how small, repeated random events can produce smooth, predictable results. When a chip falls through pegs, each decision to go left or right can be considered a binary event — yet, over many repetitions, the outcomes form a clear distribution pattern.
While the relationship between pegs and final slot position is inherently probabilistic, it often averages out to a nearly linear trend when observed in large numbers. This demonstrates how randomness, when aggregated, can produce steady, linear-like behaviors over time. In this way, the Plinko App beautifully illustrates the bridge between pure algebra and applied probability — between deterministic equations and stochastic processes.
Linear equations, though simple, help us interpret these relationships by modeling expected averages, predicting distributions, and identifying proportional dependencies even in complex, random systems.
Applications Beyond the Classroom
Linear equations power countless technologies and scientific breakthroughs. From AI algorithms that rely on linear regression to physics simulations of steady motion, they serve as the mathematical engine of prediction and optimization.
| Field | Application | Linear Equation Role |
|---|---|---|
| Artificial Intelligence | Predictive modeling | Basis of linear regression |
| Physics | Motion and force | Describes constant velocity |
| Economics | Market analysis | Represents proportional growth |
| Engineering | Structural design | Ensures balance and stability |
| Data Science | Trend prediction | Linear fit in datasets |
Even more advanced branches of mathematics — such as differential equations and matrix theory — are extensions of linear principles. Every complex model begins with a straight line.
Summary
Linear equations are more than just simple mathematical relationships — they are the language of consistency, balance, and structure. From determining how two quantities interact to understanding large-scale patterns like those seen in the Plinko App, linear equations remain fundamental to how we interpret the world.
By mastering them, you unlock the foundation of all mathematical reasoning — a world where every variable connects through clear, predictable, and beautifully simple relationships.
FAQ
A linear equation is a mathematical statement that shows a straight-line relationship between two variables. It can be written in the form y = mx + b, where m is the slope (rate of change) and b is the intercept (starting value). Linear equations describe steady growth, decline, or proportional change — fundamental concepts in algebra and real-world modeling.
A linear equation creates a straight line, while a quadratic equation produces a parabola. Linear equations represent constant change (first-degree equations), whereas quadratic equations represent accelerated change (second-degree equations). In simple terms, linear = steady rate; quadratic = variable rate.
In the Plinko App, each falling chip makes random binary moves — left or right — yet over time, these random outcomes form smooth, predictable trends. When averaged, the results often align with a linear pattern of proportional outcomes, demonstrating how even random systems can produce linear relationships at scale.
This connection between randomness and linearity shows how algebra and probability meet in practical, visual ways.
While linear equations are deterministic, they can model the expected average outcome of random systems. For instance, in the Plinko App, while individual drops are unpredictable, the overall average follows a steady trend that can be approximated by a linear relationship. This blending of order and randomness is a fundamental principle in data analysis and statistics.